Mappy: Building a Global Exploration App
During COVID, Maria reached out to me with an idea she'd been sitting on for a while. With travel off the table and most of the world suddenly very stationary, she wanted to build something that made people more aware of the places around them. An app where you could explore your immediate world and visualize everywhere you'd been by coloring it on a map. The concept was simple: as you move through the world, your map fills in. The more you explore, the more of the earth becomes yours.
The Vision
Mappy was inspired by apps like Strava, but the goal was never purely athletic. Maria's vision was broader than just fitness. It was about exploration, curiosity, and movement. Whether you walked to a new neighborhood, cycled through a forest, or just wandered somewhere unfamiliar, Mappy would record it and color that region of the map as visited.
The colored map became the core mechanic. Seeing a grey world slowly fill with color as you explored created a surprisingly powerful pull to keep going. You'd want to fill in that blank patch across town, or finally complete your city grid. Fitness was the vehicle, exploration was the reward.
Technology Stack
Frontend
- React Native (Expo) for cross-platform iOS and Android development
- Redux + Redux-Saga for state management, chosen to handle the complexity of async geolocation streams and background tracking sessions
- React Native Maps with Google Maps for the core map visualization
expo-locationandexpo-task-managerfor background location tracking
Backend
- NestJS, a structured TypeScript-first backend that made building well-defined API contracts straightforward
- MongoDB for flexible storage of geospatial location data and user-generated notes
- RabbitMQ for decoupling location sync events from immediate API processing
- AWS ECS for container-based hosting, S3 for media and asset storage
Key Architectural Decisions
Redux-Saga for geolocation state
Location tracking generates a continuous stream of events that need to be coordinated with user sessions, network state, and background/foreground transitions. Redux-Saga's channel-based model was a natural fit. I built a dedicated initGeoLocationUpdates channel that pipes Expo location events into the Redux store, with sagas handling session start/stop, syncing to the backend, and recovering gracefully when sessions were interrupted.
Expo Task Manager for background tracking
One of the harder problems was keeping location updates running when the app wasn't in focus. I used expo-task-manager to register a background task that continued recording movement even with the phone locked, which was critical for the "color your path" feature to work during longer outdoor sessions.
NestJS over Express I chose NestJS over a plain Express setup because the app had a well-defined domain model (users, tracking sessions, locations, notes, map regions) that benefited from NestJS's module structure and decorator-based validation. It also made the codebase easier to reason about as the API surface grew.
RabbitMQ for location event processing Rather than writing every GPS coordinate directly to MongoDB on each update, I published location batches to a RabbitMQ queue and processed them asynchronously. This kept API response times fast and gave room to do heavier geospatial processing (region detection, map coloring logic) out of band.
Google Maps over Mapbox
I went with Google Maps via react-native-maps for the map layer. The integration was more mature within the Expo ecosystem at the time, and Google's autocomplete and geocoding APIs were already a dependency for the location search feature, so consolidating on one provider simplified the setup.
Features
Map coloring / heatmap The heart of the app. As you moved through the world with a tracking session active, the regions you passed through filled in with color on the map. Each user had a custom color they could pick for their heatmap, so the map felt personal. The heatmap was fetched dynamically based on the current viewport, so performance stayed smooth even with a long history of sessions.
Tracking sessions A bottom drawer on the home screen let you start and stop exploration sessions with a single tap. While active, your live position was streamed to the backend and your path was drawn as a polyline on the map. Sessions persisted across app restarts via the backend, so if the app crashed mid-walk, your session was still there when you came back.
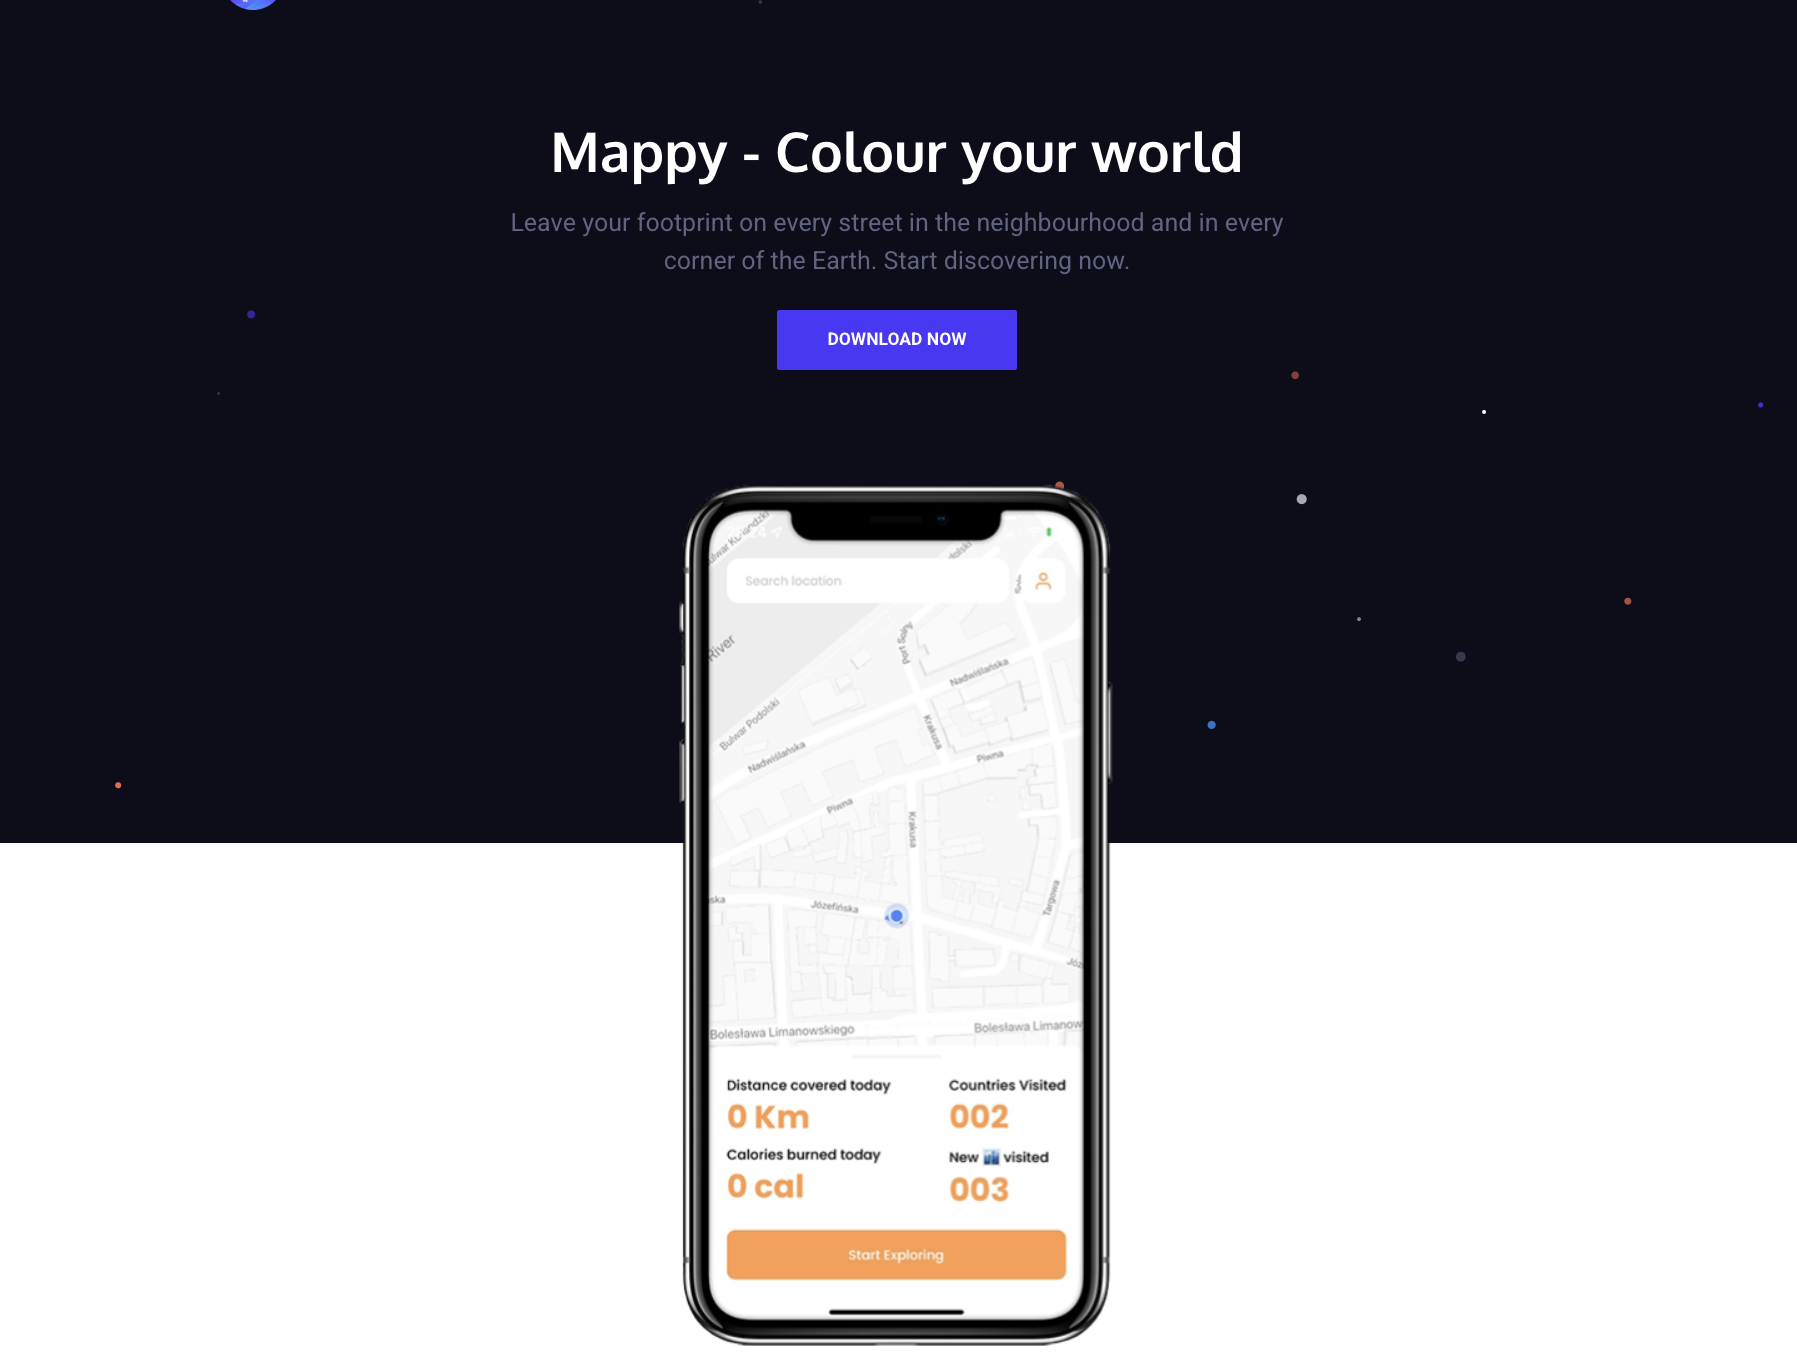
Statistics dashboard The statistics view showed a full breakdown of your activity: total distance walked, distance covered today, total calories burned, calories burned today, countries visited, and new cities discovered. There was also a leaderboard position stat, a nod toward the competitive side of the app.
Streaks Mappy tracked your current active streak and your all-time max streak in days. It was a simple mechanic but effective. The fear of breaking a streak is a strong motivator to get out for even a short walk.
Rewards and badges The app had a rewards system where users earned badges for hitting milestones. Rewards had a title and description and were displayed in a dedicated section below the statistics. The backend computed which rewards a user had earned and sent them down as part of the profile response.
Location notes You could tap anywhere on the map to pin a note at that location, a short text entry tied to a coordinate. Notes were visible on the map as markers and could be edited or deleted later. Useful for leaving yourself reminders about places ("great coffee here", "avoid this road on the bike") or just annotating your own history.
Location search A search bar at the top of the home screen let you search for any place using Google Places autocomplete. Selecting a result would pan the map to that location, useful for scoping out areas to explore or planning a route before heading out.
Profile and customization Users set up a profile with their name, height, weight, gender, and a profile photo. The height/weight data fed into the calorie calculation logic. Users also picked their personal map color, the one used for their heatmap and visible to others on the leaderboard.
Authentication Sign-in via Apple ID, Facebook, or email/password registration. Apple and Facebook auth were handled through Expo's auth modules, with JWTs issued by the NestJS backend on successful authentication.
Launch and Outcome
Mappy launched on both the App Store and Google Play. It found an early audience. The core loop of coloring the map resonated with people who liked the idea of turning their daily movement into something visual and cumulative. Initial retention was encouraging.
Over time though, the app faced the challenge that many niche consumer apps do: sustaining growth without a dedicated marketing effort, and standing out in a space where well-funded competitors were shipping fast. Maria ultimately decided not to continue development, and the app was sunset.
Since then, we've decided to open source the codebase. If you're curious about the implementation or want to build on top of it, the code is available on GitHub.
Reflections
Working with Maria on Mappy was a good lesson in the gap between a compelling product idea and the sustained effort required to grow it. The technical execution held up. The app was stable, the tracking worked, and the core interaction was genuinely enjoyable. The limiting factor was distribution, not the product itself.
From a technical standpoint, the most valuable takeaway was building reliable background location tracking in React Native. It's one of those features that seems straightforward until you're debugging session state across app lifecycle events at 2am. Redux-Saga's explicit handling of side effects made that complexity manageable in a way that a simpler state solution wouldn't have.